What to Eat to Save the Planet: Three Tradeoffs to Consider
Written by Jess McCluney
Research contributed by Bobbie Buzzell and Corinne Noufi
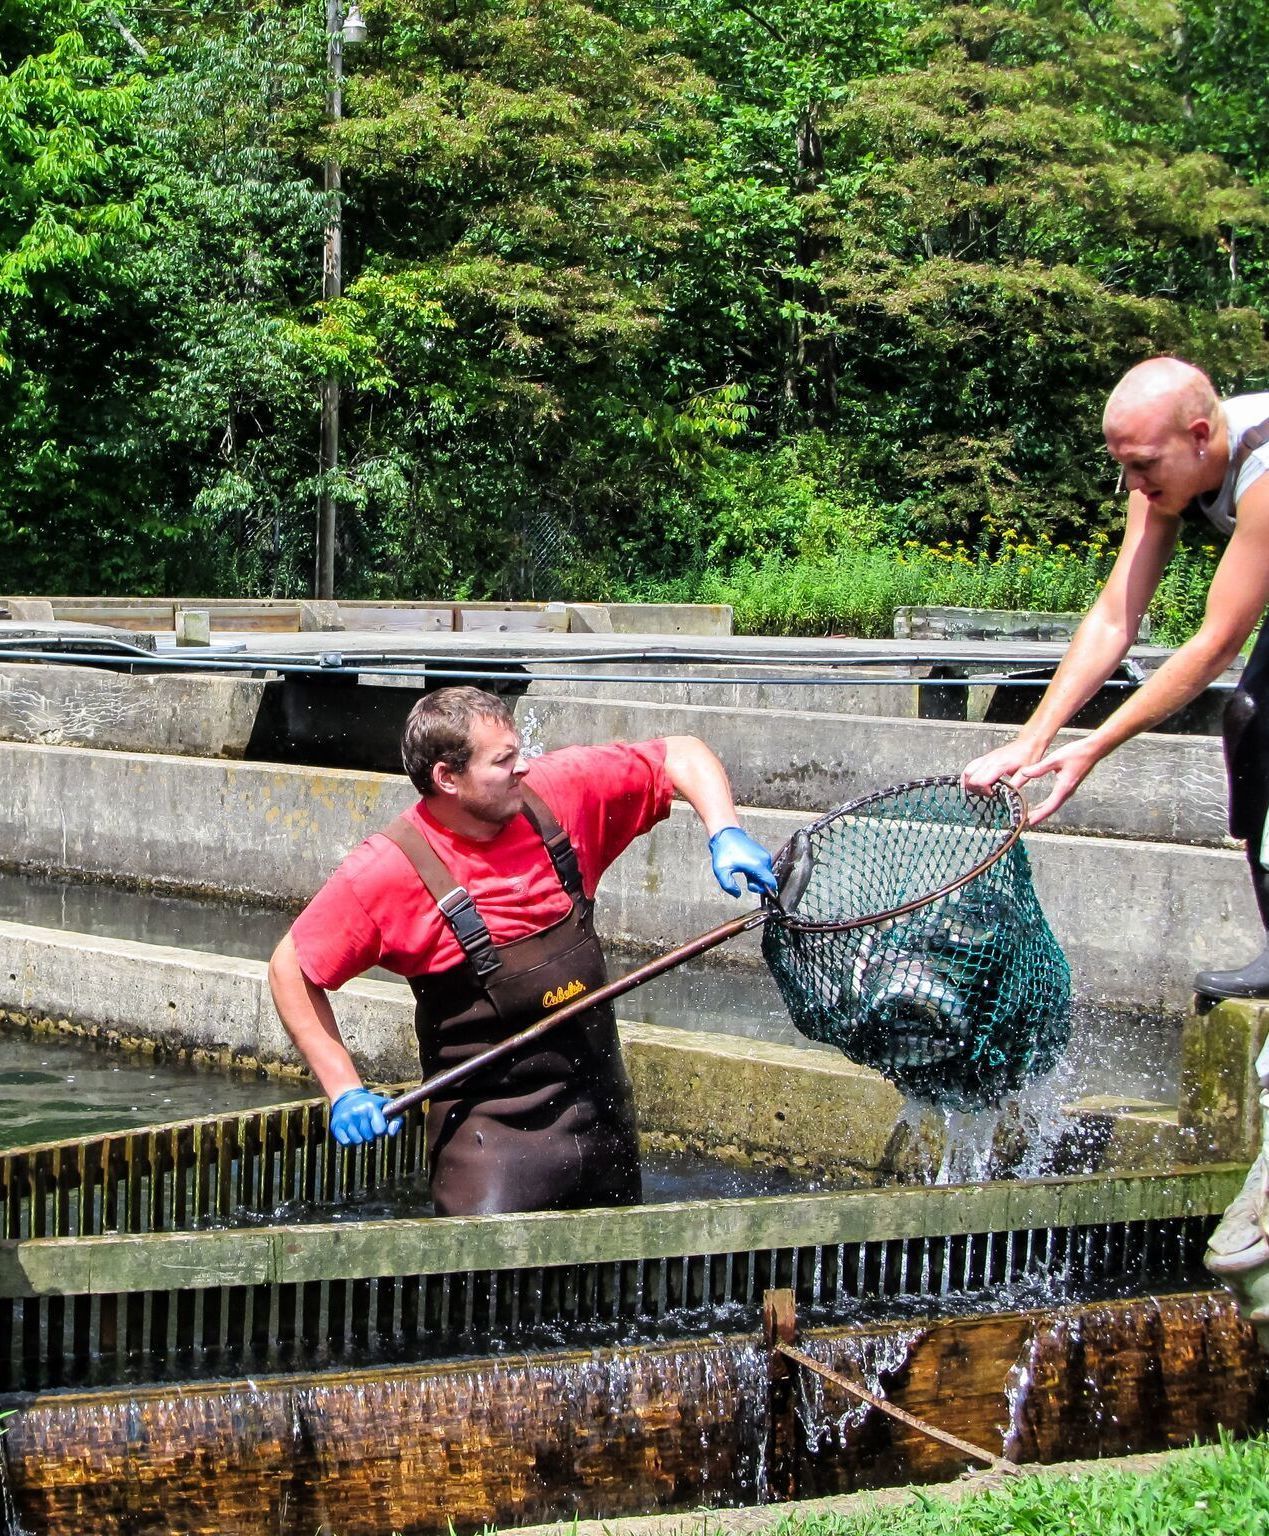
Feature photo courtesy of Sunburst Trout
What to eat to save the planet
Choosing groceries has environmental tradeoffs
Deciding which protein option is more sustainable for your family is at best complicated, and often makes us as consumers feel underinformed and overwhelmed. We typically end up opting for the packaging label that does the best job aligning with our values, and ignoring that inner voice questioning whether it’s just ‘marketing’. We all care about finding animal protein we feel good about, yet when trying to weigh the considerations of comparing different grocery items we simply block out the decision process. We offer one potential approach – by viewing this decision process through the lens of weighing three major tradeoffs when comparing various seafood and land animals.
Bottom line: Farming food impacts the environment.
Making responsible grocery choices is hard because all food production – agriculture, livestock, aquaculture, and even wild fisheries – have an impact on the environment. In agriculture hundreds of thousands of acres are solely dedicated to monocultured crops, much of which goes straight to feeding animals (explored in our feed usage article). Raising livestock requires enormous amounts of natural resources, in addition to their feed requirements. In aquaculture there is concern over the impact escaped fish will have on the native ecosystem (explored in our escapement article). Even in wild fisheries, about half the operating cost of a typical offshore fishing trip goes to a significant amount of diesel fuel, regardless whether quotas are set under a sustainable threshold.14 Whether fins or limbs, any source of animal protein will have some consequences that vary from system to system and even operation to operation. Our quest therefore, is to determine the tradeoffs that most align with our individual values.
Identifying different environmental impacts from farmed animal production
This article examines three primary impacts across animal production methods: global warming potential (through greenhouse gas emissions), eutrophication potential, and acidification potential. There are certainly more environmental impacts from animal production systems which we do not examine below but are touched upon here that are incredibly difficult for scientists to generate a consistent measurement across production systems to make side-by-side comparisons, including the usage of pesticides and antibiotics, soil erosion, habitat destruction, and loss of biodiversity. By having a better understanding of how our food has an impact on things like water and air pollution we can make more informed choices about how to feed ourselves in ways that have the least environmental impact, or avoid effects we each find important.
Tradeoff 1: Greenhouse Gas Emissions
Greenhouse gas impacts from livestock
One of the major drivers of climate change is human sources of greenhouse gases (GHG).  Ritchie, H., & Roser, M. (2020, January 15) Our food contributes to these emissions through carbon dioxide emitted in transport and methane produced by cattle and other ruminants. Each source of protein production contributes different amounts of greenhouse gases, and these differences can be striking. About 80% of GHG emissions from animal protein sources are a result of land use (mostly for growing feed). Also taken into account is the deforestation to place farms, and emissions from processing, transportation, and feed production.8
Beef contributes 36% of food-sourced greenhouse gas (GHG) emissions.5 Interestingly, grass-fed beef generates higher GHG emissions than non grass-fed beef.6 Pork, followed by chicken, also exert high impact from land usage but as they are not ruminant animals and therefore do not emit methane, both categories average overall lower GHG emissions relative to beef. A 2014 climate change study out of the UK highlighted that if a person were to shift their meat-based diet from more than 100g (3.5oz) of meat per day to less than 50 g/day (1.75oz), replacing the difference with seafood, they would reduce their GHG contribution by 920 kg (nearly 1 ton) of carbon dioxide per year.10
Greenhouse gas impacts from aquaculture
As we start to look at aquaculture, the variety of different methods used to farm different species contributes to a wide range of GHG emission levels. Those differences primarily boil down to whether the fish require feed, and whether the production requires energy for water circulation.6 Farmed species like oysters, mussels, and clams who are filter feeders, require no feed and therefore do not contribute to GHG through altering land use; finfish typically must be fed and will vary a little in their feed efficiencies. Importantly, all species of farmed fish more efficiently utilize their feed than any livestock, significantly lowering their overall contribution toward GHG emissions.2 3 4
Fish grown in contained land-based systems also have a wide range of GHG emissions. Aquaculture in the natural aquatic environment requires almost no land use nor energy for water circulation, both lowering overall GHG emissions, but does introduce a risk of impacting the surrounding aquatic environment. Of farmed fish, catfish and carp have the highest GHG emissions,6 while farmed salmon has among the lowest GHG emissions, particularly because salmon pens require no water pumping, and salmon convert their feed into body mass very efficiently.2 However, one tradeoff for salmon’s ultra low GHG footprint to consider is the concern around the open net pen farming method commonly used to raise them – in particular, the ecosystem impacts from a possible escapement. Alternatively, there is an increasing number of cutting edge land-based salmon production systems which eliminates this concern, for example Finger Lakes Fish in upstate New York.
Greenhouse gas impacts from wild fisheries
When harvesting wild fish, the GHG impact (and acidification which we explain later) depends primarily on fuel use, which is subsequently a measure of how efficiently fish can be captured (given trip lengths, gear type, mechanical technology, etc).6 Studies have shown that small pelagic fish, such as anchovy, herring, mackerel, and sardines, who form dense schools and are typically captured via purse seining or midwater trawl, exhibit the lowest GHG impact of wild fisheries. Gear methods to catch fish species living on or near the seafloor exert a medium GHG impact, while the highest GHG impact is exerted by trawl or by pot methods that catch invertebrate species such as crab, lobster, scallop, and octopus. Interestingly, dropping pots has far lower energy demands than trawling, which involving dragging a net through the water. However, the commercial value of species like lobster, crab, and scallop is so high that fishermen will use a high amount of fuel to seek and capture these species consistently enough that there is a direct statistical relationship between the price of the product and the amount of fuel expended.6 15
Tradeoff 2: Eutrophication
How does farmed animal production impact eutrophication?
Eutrophication occurs when nutrients from chemical fertilizer and natural farm waste (mainly nitrogen and phosphorous) enter waterways and fertilize native algae, causing to blooms whose decay leads to low or no oxygen conditions, ultimately killing of pushing out aquatic life. The global average eutrophication emissions per 100g (3.5oz) of protein is three times higher for dairy and beef cows compared to farmed fish.8 Excess nutrients enter waterways from sources such as fertilizers and livestock manure. So it is again unsurprising that beef, mainly due to manure running into soil and waterways as well as deforestation, exhibits the highest average eutrophication potential.
How does aquaculture impact eutrophication and what can multi-trophic aquaculture do?
While all farmed fish average better than b Ritchie, H., & Roser, M. (2020, January 15)eef, catfish, carp, and tilapia all have higher average eutrophication potential than either chicken or pork.6 Interestingly, the aquaculture industry is beginning to capitalize on the natural tendencies of farmed oysters, clams, and mussels (the bivalve family) to reverse eutrophic effects. All bivalves reduce eutrophication potential by absorbing excess nutrients from the water. Fish producers are starting to introduce integrated multi-trophic aquaculture (IMTA), a system that harnesses the ecological benefits of bivalves (and kelp) with finfish aquaculture.1 Some forward-thinking land-based aquaculture systems, like Superior Fresh farms in Wisconsin, have adopted this practice by growing leaf lettuces alongside their fish, recycling their nutrients and resulting in virtually zero eutrophication potential, explained in their interview. Since 2009 the University of Maine has conducted several trial studies illustrating that IMTA can work in aquatic systems as well as land-based systems.12 In fact, some fish farmers in Maine continuously move their net pens from farm site to farm site to prevent waste buildup and keep up with more balanced nutrient cycling.9 11 You can read more on aquaculture improvements over time here.
Tradeoff 3: Acidification
What are the acidification impacts from livestock and aquaculture? Hilborn, R., J. Banobi, S. J. Hall, T. Pucylowski, and T. E. Walsworth. 2018.
A third tradeoff we can balance when selecting our food is the acidification potential generated from the production systems of the animals we eat. This is important because many nutrients like sulfates, ammonia, and nitrous oxides from food production can increase the acidity of both water and soil, leading to acid rain and fog in extreme cases. This slough of excess nutrients can come from sewage treatment plants, fertilizers, and industrial waste. The nitrogen compounds in manure production are the primary driver of acidification potential across livestock, where beef was found to have the highest average acidification potential.6 Fuel usage is the major source of acidification potential in both aquaculture and capture fisheries, due to the acidifying compounds in fuel.6 Bivalves and salmon aquaculture show the lowest acidification potential in aquaculture systems, with wild-caught small pelagic and whitefish fisheries having relatively low acidification potential as well.
Eat to save the planet
Support the environment and be aware of your trade offs at the grocery store
While putting any type of food on your plate has an environmental footprint, there are options that clearly outperform others. The future of the planet will require both a shift in protein sources and responsible methods of production, and shifting diets toward embracing responsible aquaculture will advance this goal. As we begin to understand the nuances of only three environmental impacts presented in this article, we can begin weighing the tradeoffs associated with each animal production system. With balanced information, and continuing to demand better information be made available, we can shift our animal consumption to help balance these tradeoffs, or simply choose the tradeoffs that are more palatable to us individually. We could also just eat less in general.
SOURCES
1.Chopin, T., J. A. Cooper, G. Reid, S. Cross, and C. Moore. 2012. Open-water integrated multi-trophic aquaculture: Environmental biomitigation and economic diversification of fed aquaculture by extractive aquaculture. Reviews in Aquaculture 4:209–220.
2.Fry, J. P., Mailloux, N. A., Love, D. C., Milli, M. C., & Cao, L. (2018). Feed conversion efficiency in aquaculture: do we measure it correctly? Environmental Research Letters, 13(2), 024017. doi: 10.1088/1748-9326/aaa273
3.Global Aquaculture Alliance. (n.d.). Why It Matters " Global Aquaculture Alliance. Retrieved from https://www.aquaculturealliance.org/what-we-do/why-it-matters/
4.GSI Protein Production Facts. (n.d.). Retrieved from https://globalsalmoninitiative.org/en/sustainability-report/protein-production-facts/#energy-retention.
5.Heller, M. C., and G. A. Keoleian. 2015. Greenhouse gas emission estimates of U.S. dietary choices and food Loss. Journal of Industrial Ecology 19:391–401.
6.Hilborn, R., J. Banobi, S. J. Hall, T. Pucylowski, and T. E. Walsworth. 2018. The environmental cost of animal source foods. Frontiers in Ecology and the Environment 16:329–335.
7.Parker, R. W. R., J. L. Blanchard, C. Gardner, B. S. Green, K. Hartmann, P. H. Tyedmers, and R. A. Watson. 2018. Fuel use and greenhouse gas emissions of world fisheries. Nature Climate Change 8:333–337.
8.Ritchie, H., & Roser, M. (2020, January 15). Environmental impacts of food production. Retrieved from https://ourworldindata.org/environmental-impacts-of-food
9.Rust, M. B., Amos, K. H., Bagwill, A. L., Dickhoff, W. W., Juarez, L. M., Price, C. S., Rubino, M. C. (2014). Environmental Performance of Marine Net-Pen Aquaculture in the United States. Fisheries, 39(11), 508–524. doi: 10.1080/03632415.2014.966818
10.Scarborough, P., Appleby, P. N., Mizdrak, A., Briggs, A. D. M., Travis, R. C., Bradbury, K. E., & Key, T. J. (2014). Dietary greenhouse gas emissions of meat-eaters, fish-eaters, vegetarians and vegans in the UK. Climatic Change, 125(2), 179–192. doi: 10.1007/s10584-014-1169-1
11.Southerland Land Exchange. (n.d.). Retrieved from https://www.southernlandexchange.com/
12.University of Maine. (n.d.). Integrated Multi-Trophic Aquaculture - Center for Cooperative Aquaculture Research - University of Maine. Retrieved from https://umaine.edu/cooperative-aquaculture/integrated-multi-trophic-aquaculture/
13.Tilman, D., & Clark, M. (2014). Global diets link environmental sustainability and human health. Nature, 515(7528), 518–522. doi: 10.1038/nature13959
14.Mccluney, J. K., Anderson, C. M., & Anderson, J. L. (2019). The fishery performance indicators for global tuna fisheries. Nature Communications, 10(1). doi: 10.1038/s41467-019-09466-6
15.Tyedmers, P. (2004). Fisheries and Energy Use. Encyclopedia of Energy, 683–693. doi: 10.1016/b0-12-176480-x/00204-7